This is a 2-part series which describes my MPhil research on the spread of Pandemic (H1N1) 2009 in Hong Kong. The 1st part (this post) gives background information to the research and describes the exploratory plots I did with the surveillance data, while the 2nd part (under construction) describes a model I built to quantify the effect of school closure in reducing the spread of the pandemic. These 2 posts aim to be layman-friendly, as the intended audience are anyone who stumbles upon my blog. Audience interested in knowing greater detail may refer to my thesis.
Public Health Response to Pandemic (H1N1) 2009 in HK
Pandemic (H1N1) 2009 is the influenza pandemic that happened in 2009. Soon after the pandemic virus was discovered in the US in April, in Hong Kong, the local government quickly implemented containment phase measures and established a reporting criteria for the report of suspected pandemic cases for laboratory confirmation. As part of containment phase measures, confirmed cases were isolated in hotels and holiday camps to contain the infection, and their source of infection was traced to determine if the infection was acquired locally. If the confirmed case was a kindergarten, primary school or secondary student, their school would be closed individually for 1 week to pre-emptively stop locally transmission.
Evidence for local transmission emerged on 10 June, and the local government swiftly began mitigation phase measures: 8 Designated Flu Clinics were opened across the territory to provide care to patients with influenza-like-illnesses, and patients who sought care at these 8 clinics were continually laboratory-tested for confirmation of pandemic infection; All kindergartens, primary schools were immediately closed, while secondary schools were individually closed for 2 weeks if any student were confirmed of infection. This school closure policy lasted until summer holiday began in July, and was revised to individual school closure for all 3 types of schools if an outbreak occurred amongst students. In September, in light of pandemic infection had dominated the majority of influenza-like cases which made laboratory testing no longer necessary, laboratory testing of cases were stopped.
The following diagram provides a graphical summary of the changes in control measures, reporting criteria and school session in Hong Kong from May through September 2009.
 |
| Figure 1. Time line of events and daily incidence of Pandemic (H1N1) 2009 in Hong Kong. |
Surveillance Data & Exploratory Plots
Laboratory testing data were stored at the E-flu database managed by the Hospital Authority. For each confirmed case, the age and residential address of the patient, and the time of confirmation were recorded and available for analysis.
School closure is a highly debatable pandemic control measure since it is a socially costly intervention and its effectiveness in reducing transmission is uncertain. Intuitively, school closure reduces the frequency of children interacting with each other, thus reducing the chance transmission is spread amongst them. However, it is not unnecessary that transmission amongst children and pandemic incidence in children would be lessen as result as children could gather in venues outside school such as in cram schools, playgrounds, libraries, so on. Thus the surveillance data collected in this pandemic provides a valuable opportunity for investigating if this intervention is effective and for characterising its effect.
The below diagram shows pandemic incidence of different age groups. Pre-schoolers are children aged 0-5 and they represent babies and kindergarten students; Students are children aged 6-19 and they represent primary and secondary school children. Adults and Retirees are persons aged 20-60 and 61+, respectively. In the diagram, it can be observed that: although the epidemic curve of Students show no obvious decline when schools were closed for summer holiday (which effectively is school closure for all schools), when schools resume session in September, the epidemic curve rose rapidly and dominated the majority of cases, suggesting that school session did increase incidence in students, most likely through student-student transmission.
 |
| Figure 2. Age-specific epidemic curves of Pandemic (H1N1) 2009 in Hong Kong |
Next, we can combine the residential address of cases with the age and confirmation date information used in the above to produce an animation of the spatio-temporal distribution of infected cases by age-groups (shown below). Each dot on the map represents the residential location of the infectee while the colour scheme for age groups has remained the same. The spatial boundaries on the map represent 18 Districts of Hong Kong.
 |
| Figure 3. Spatio-temporal distribution of Pandemic (H1N1) 2009 cases in Hong Kong |
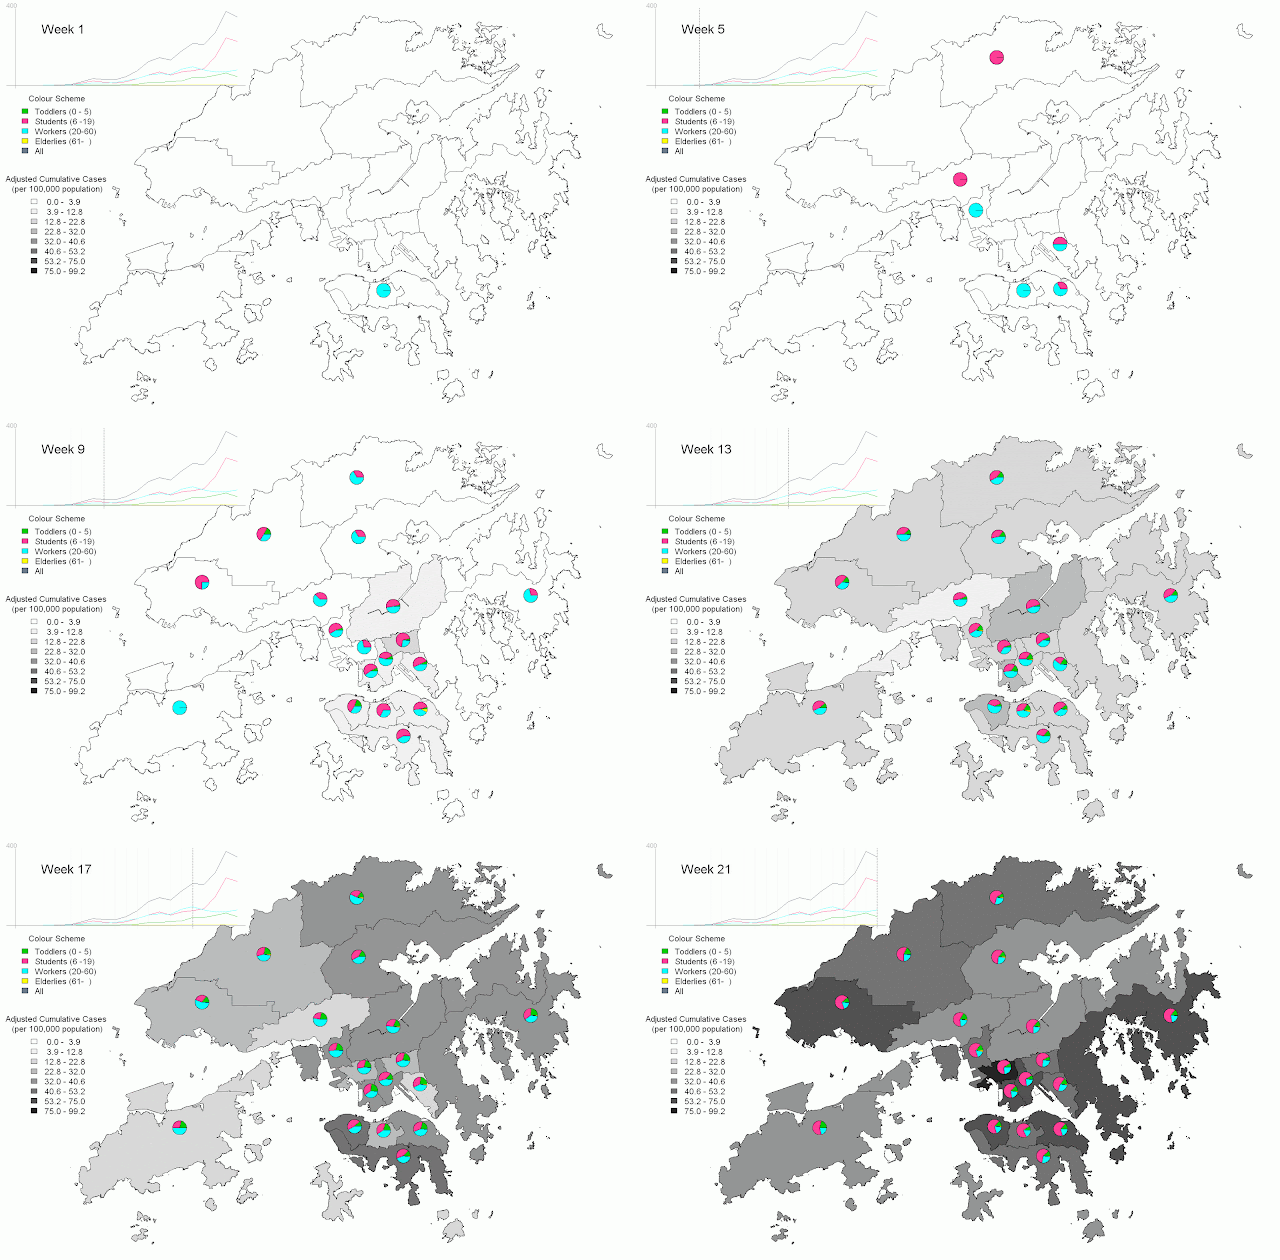
As it is difficult to comprehend the information shown on the map with hundreds of points flashing quickly over it, we may compute some spatial statistics from the data to help us better understand the data. Figure 4. shows age-specific epidemic curves aggregated at the district-level. It can be seen that most district-level epidemic curves resemble the epidemic curve for the whole of Hong Kong, indicating that the spatial spread of cases was fairly homogeneous. Figure 5. shows an animation showing the proportion of cases in each age group by week by district, again, it can be observed that the age distribution of cases across districts are fairly similar.
 |
| Figure 4. District-and-age-specific epidemic curves of Pandemic (H1N1) 2009 in Hong Kong |
 |
| Figure 5. Weekly age-profile of Pandemic (H1N1) 2009 cases by the 18 District of Hong Kong |
